Thermodynamic database
Components (14)
Total of 14 components are included in the database as listed here:
Al, Cr, Fe, Hf, Mo, Nb, O, Re, Si, Ta,Ti, V, W, and Zr
Suggested Composition Range
The suggested composition range for each element is listed in Table 1. It should be noted that this given composition range is rather conservative. It is derived from the chemistries of the multicomponent commercial alloys that have been used to validate the current database. In the subsystems, many of these elements can be applied to a much wider composition range. In fact, some subsystems are valid in the entire composition range as given in Section Assessed Subsystems.
| Elements | Composition Range (wt.%) |
|---|---|
|
Nb |
50 ~ 100 |
|
Si, Ti |
0 ~ 30 |
|
Cr |
0 ~ 20 |
|
Al, Hf, V |
0 ~ 10 |
|
Fe, Mo, O, Ta, Re, W, Zr |
0 ~ 5 |
What is new in PanNb2024
Addition of the component O
Phases
Total of 192 phases are included in the database and a few key phases are listed in Table 2. Information on all phases is listed in PanNb2024: List of Phases. Users can also view it through TDB viewer of Pandat™.
Assessed Subsystems
A total of 113 subsystems, including 89 binary and 24 ternary subsystems have been assessed. The modeling status is indicated by numbers. The systems with number 10 are fully assessed in the whole composition range. The higher value shows higher reliability of the system.
Binary Systems (89)
| Al-Cr(10) | Al-Fe(10) | Al-Hf(10) | Al-Mo(10) | Al-Nb(10) | Al-O(10) | Al-Re(10) |
| Al-Si(10) | Al-Ta(10) | Al-Ti(10) | Al-V(10) | Al-W(10) | Al-Zr(10) | Cr-Fe(10) |
| Cr-Hf(10) | Cr-Mo(10) | Cr-Nb(10) | Cr-O(10) | Cr-Re(10) | Cr-Si(10) | Cr-Ta(10) |
| Cr-Ti(10) | Cr-V(10) | Cr-W(10) | Cr-Zr(10) | Fe-Hf(10) | Fe-Mo(10) | Fe-Nb(10) |
| Fe-O(10) | Fe-Re(10) | Fe-Si(10) | Fe-Ta(10) | Fe-Ti(10) | Fe-V(10) | Fe-W(10) |
| Fe-Zr(10) | Hf-Mo(10) | Hf-Nb(10) | Hf-O(10) | Hf-Re(10) | Hf-Si(10) | Hf-Ta(10) |
| Hf-Ti(10) | Hf-W(10) | Hf-Zr(10) | Mo-Nb(10) | Mo-O(10) | Mo-Re(10) | Mo-Si(10) |
| Mo-Ta(10) | Mo-Ti(10) | Mo-V(10) | Mo-W(10) | Mo-Zr(10) | Nb-O(10) | Nb-Re(10) |
| Nb-Si(10) | Nb-Ta(10) | Nb-Ti(10) | Nb-V(10) | Nb-W(10) | Nb-Zr(10) | O-Re(5) |
| O-Si(10) | O-Ta(10) | O-Ti(10) | O-V(10) | O-W(10) | O-Zr(10) | Re-Si(10) |
| Re-Ta(10) | Re-Ti(10) | Re-W(10) | Re-Zr(10) | Si-Ta(10) | Si-Ti(10) | Si-V(10) |
| Si-W(10) | Si-Zr(10) | Ta-Ti(10) | Ta-V(10) | Ta-W(10) | Ta-Zr(10) | Ti-V(10) |
| Ti-W(10) | Ti-Zr(10) | V-W(10) | V-Zr(10) | W-Zr(10) |
Ternary Systems (24)
| Al-Nb-Ti(10) | Cr-Fe-Si(10) | Cr-Hf-Si(10) | Cr-Nb-Si(10) | Cr-Nb-Ti(10) | Cr-Nb-V(10) |
| Cr-Nb-Zr(10) | Cr-Si-Ti(10) | Cr-Si-V(10) | Cr-Ti-Zr(10) | Fe-Nb-Ti(10) | Hf-Nb-Si(10) |
| Hf-Nb-Zr(10) | Hf-Si-Ti(10) | Mo-Nb-Re(10) | Mo-Nb-W(10) | Mo-Si-Ti(10) | Nb-Re-Zr(10) |
| Nb-Si-Ti(10) | Nb-Si-W(10) | Nb-Ta-Zr(10) | Re-Ti-Zr(10) | Ta-Ti-Zr(10) | Ta-V-W(10) |
Database Validation
The current PanNb database was validated by large amounts of phase equilibrium data available for Nb alloys. A few examples are given here. Figure 1 shows the calculated liquidus projection of the Nb-Ti-Si system together with the experimental data [1997Bew]. The different symbol of experimental data denotes that the primary solidification phase observed in the as-cast microstructure of the alloy. The two invariant reactions at the metal-rich region of Nb-Ti-Si are L+Nb5Si3 →Ti5Si3+Nb3Si at 1599 °C and L+Nb3Si → Ti5Si3+Bcc at 1359 °C.
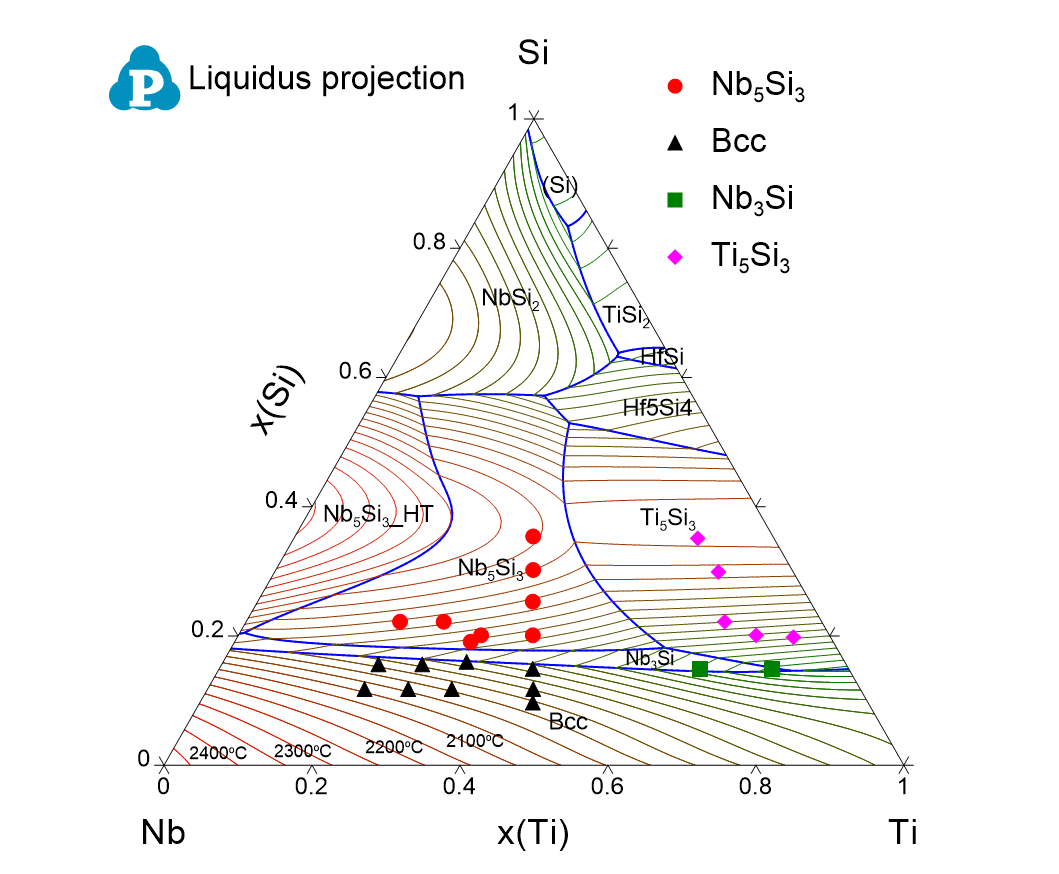
Figure 2 and Figure 3 show the calculated isothermal section of Nb-Ti-Si at 1500 °C and 1340 °C, respectively. The experimental data are also plotted for comparison. The phase compositions are from EPMA measurements. The detail of experiments can be found in literature [1998Bew]. Different shapes of the symbols denote the different phase regions where the alloys are located. The green lines are tie lines.
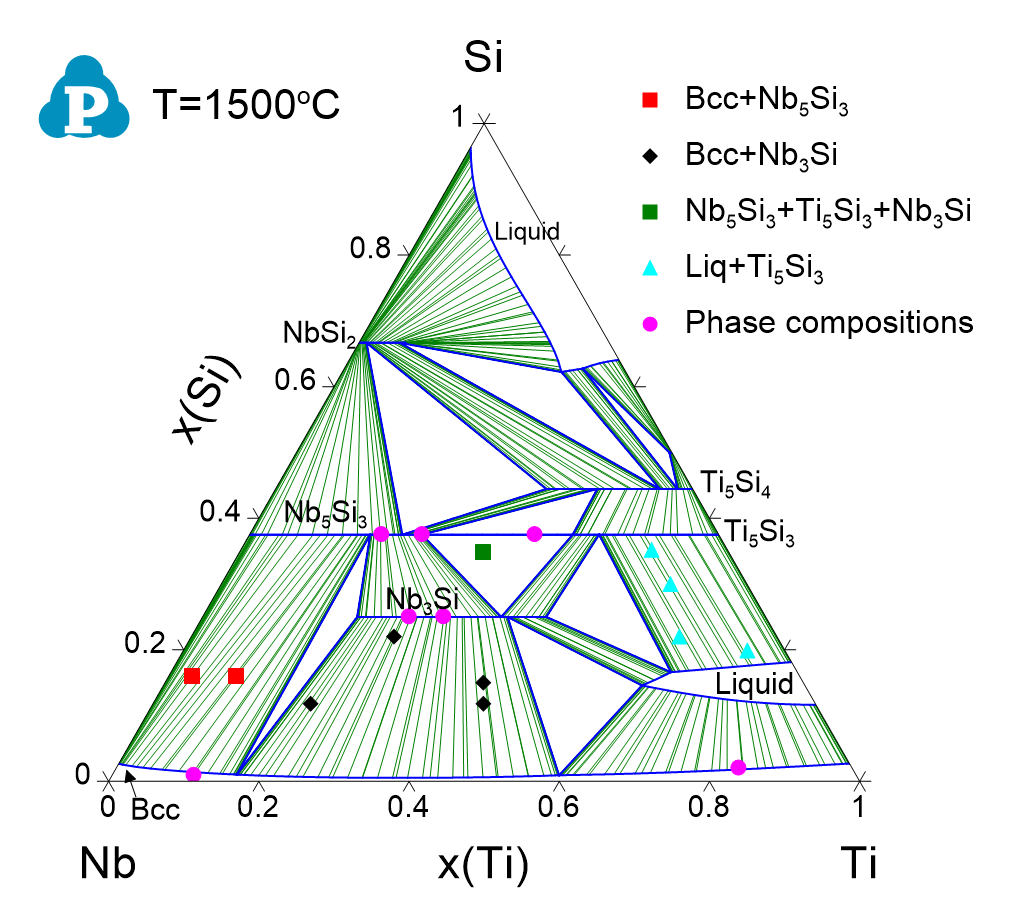
Figure 2: Calculated isothermal section of Nb-Ti-Si at 1500 °C together with experimental data [1998Bew]
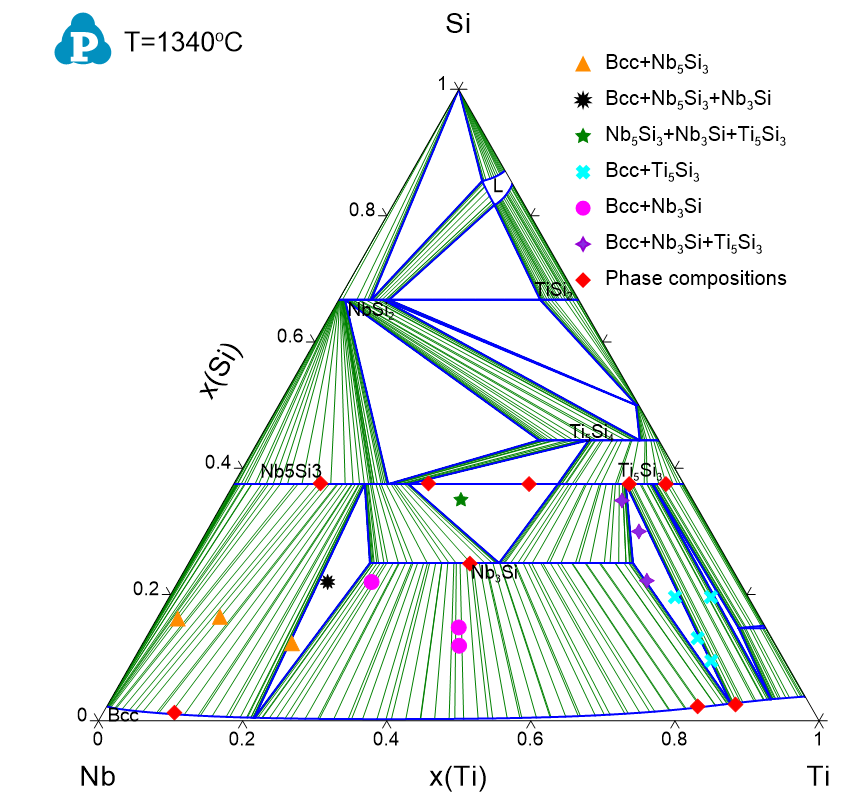
Figure 3: Calculated isothermal section of Nb-Ti-Si at 1340°C together with experimental data [1998Bew]
Figure 4 shows the calculated liquidus projection of Nb-Cr-Si overlaid by experimental data. Again, the different symbol of experimental data [2007Bew] denotes that the primary solidification phase observed in the as-cast microstructure of the alloy.Figure 5 shows the calculated isothermal section of Nb-Cr-Si at 1100 °C. In PanNb, a ternary phase Nb9Si2Cr3, was included in the thermodynamic description of the Nb-Cr-Si system for the first time.
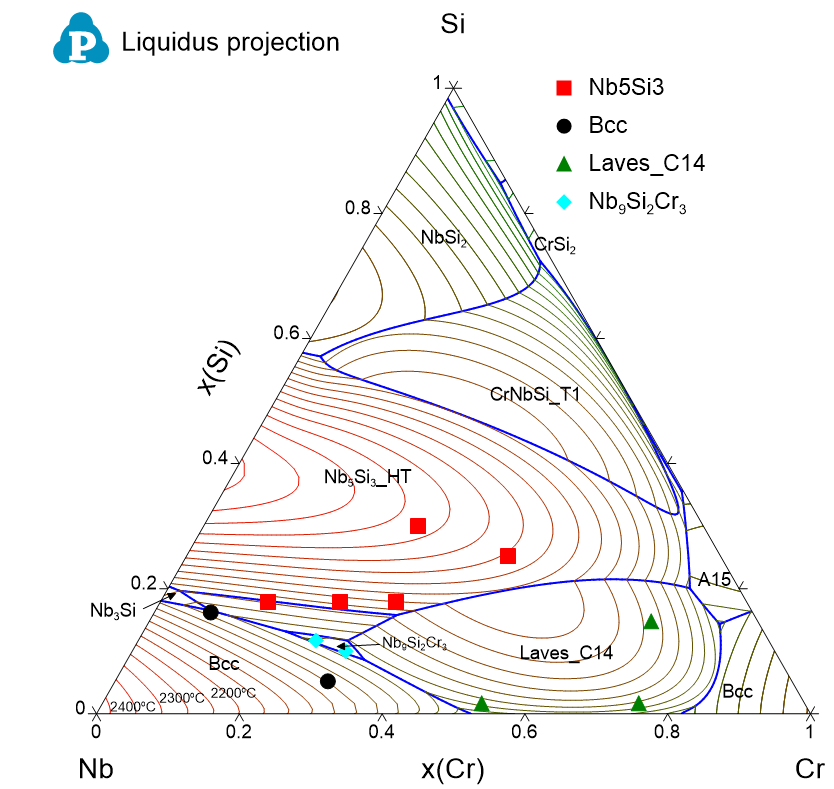
Figure 4: Calculated liquidus projection of Nb-Cr-Si together with experimental data [2007Bew, 2009Bew]
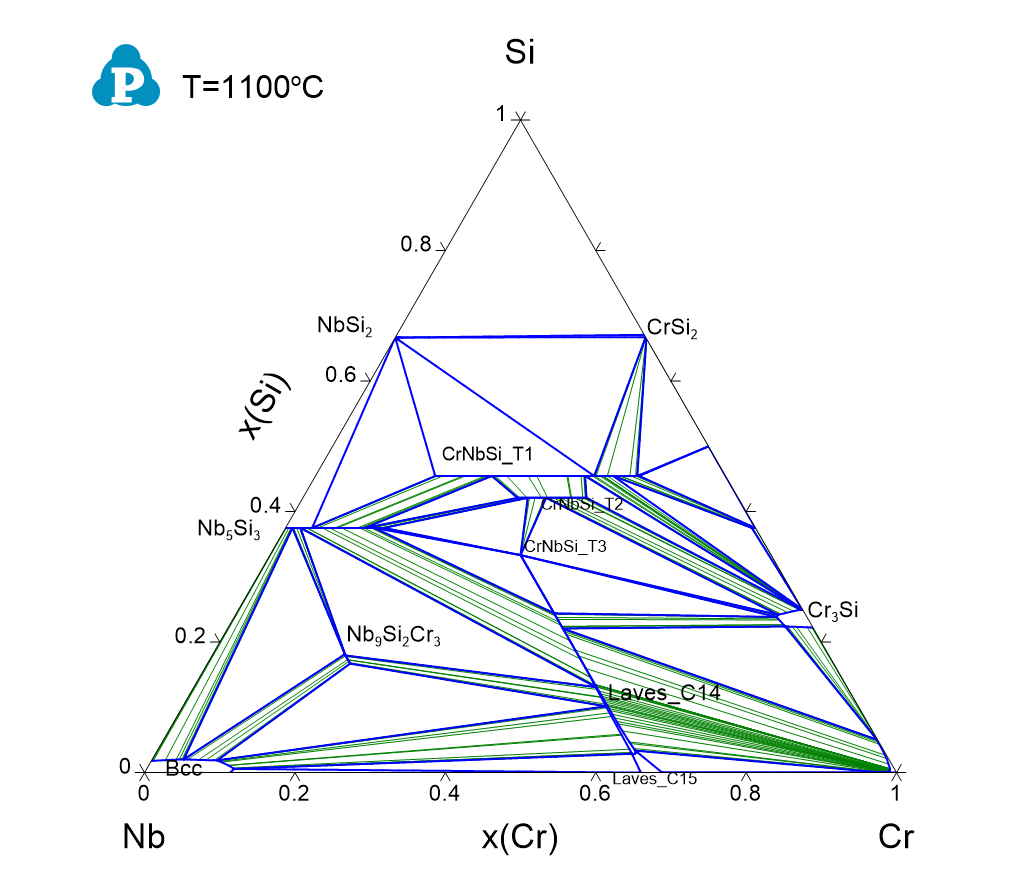
Figure 6 shows the calculated liquidus projection of the Nb-Si-Hf overlaid by experimental data [1999Bew]. Again, the different symbol of experimental data denotes that the primary solidification phase observed in the as-cast microstructure of each alloy. The three invariant reactions at the metal-rich region of Nb-Hf-Si are L+Hf5Si3 → Nb5Si3_LT+Hf2Si at 2035 °C, L+Nb3Si → Nb5Si3_LT + Bcc at 1836 °C and L+Nb5Si3_LT → Hf2Si + Bcc at 1822 °C. Figure 7 shows the calculated isothermal section of Nb-Hf-Si at 1500 °C together with experimental data.
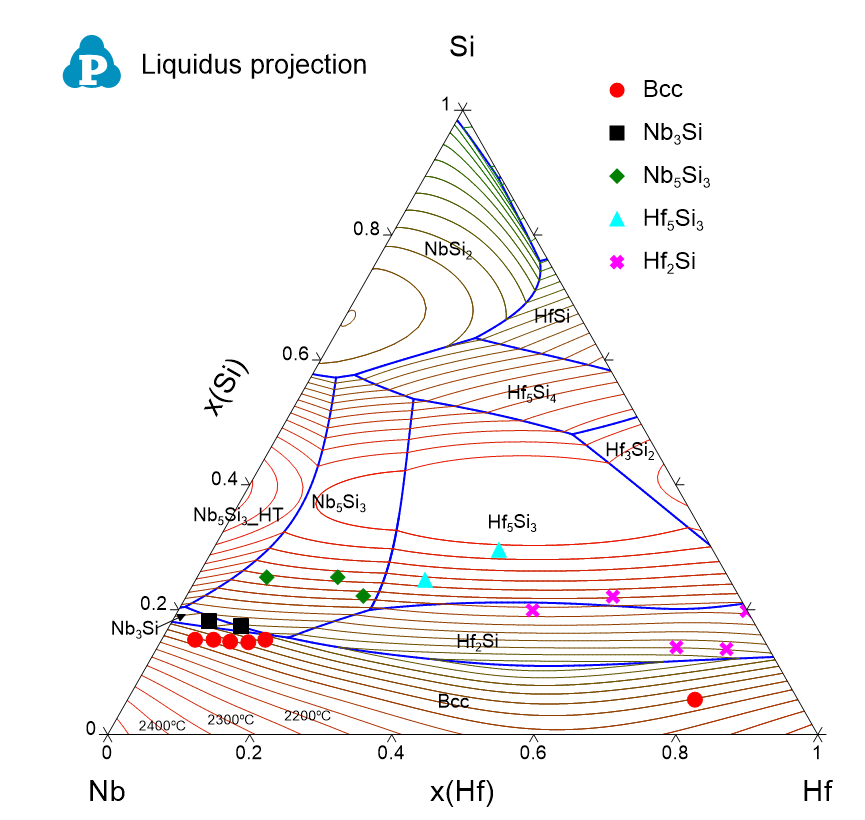
Figure 6: Calculated liquidus projection of Nb-Hf-Si together with experimental data [1999Bew, 2003Yan]
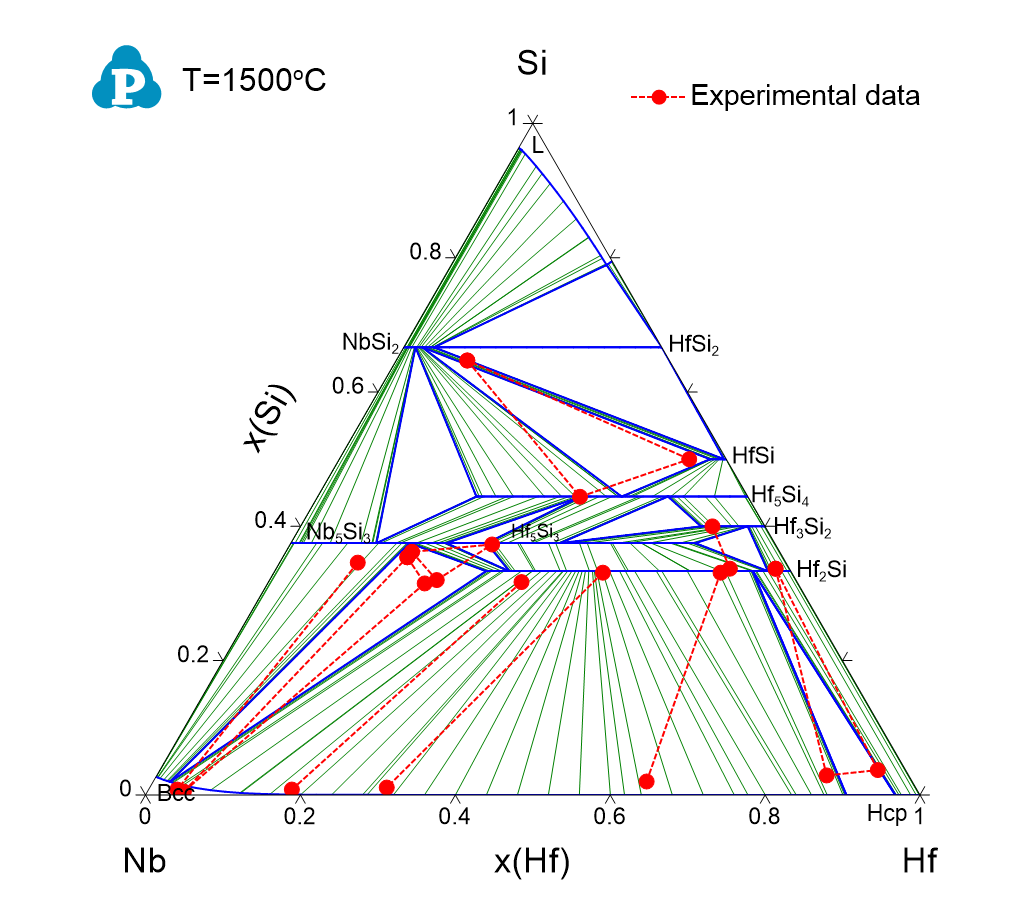
Figure 7: Calculated isothermal section of Nb-Hf-Si at 1500 °C together with experimental data [2001Zha]
Comparisons between the calculated phase compositions (in parentheses) and the EPMA measurements for two Nb-Cr-Ti-Si alloys are shown in Table 3. These measured phase compositions were not used in model parameter optimization. Instead, they were only used for validation of the calculated results. In view of this, the calculated phase compositions from the current thermodynamic description agree well with the experimental measurements. However, the users should be cautious on the discrepancy between the calculated and measured Cr and Nb compositions for the Laves_C14 phase.
Figure 8(a)-(b) show the simulated solidification paths for the Nb-11Cr-23Ti-13Si, and Nb-21Cr-23.5Ti-15.5Si alloys. The BSE images of the as-cast microstructures of these two alloys are shown in Figure 8(c)-(d), respectively. The phase observed in the BSE images is well predicted by the lever-rule simulation and the early stage of the Scheil simulation. The additional phases predicted by the Scheil model were not identified in the BSE images, which maybe either due to the small amount presented in the microstructure or the micro-segregation in real cooling condition is not as severe as assumed by Scheil simulation. Figure 9 (a) and (b) show the solidification path simulations under the Scheil and lever-rule condition for the six component Nb-22Ti-2Hf-4Cr-3Al-16Si alloy, and the BSE image of the as-cast microstructure of the same alloy. The microstructure consists of two phases (Nb) and Ti5Si3, which is well predicted by the lever-rule simulation as shown by the dash line in Figure 9 (a). The Scheil simulation predicted the formation of Ti5Si3 and Laves_C14 in addition to (Nb) and Ti5Si3. However, the total mole percentage of Ti5Si3 and Laves_C14 is predicted to be less than 5%. Again, the additional phases predicted by the Scheil model were not identified in the BSE images, which maybe either due to the small amount presented in the microstructure or the micro-segregation in real cooling condition is not as severe as assumed by Scheil simulation.
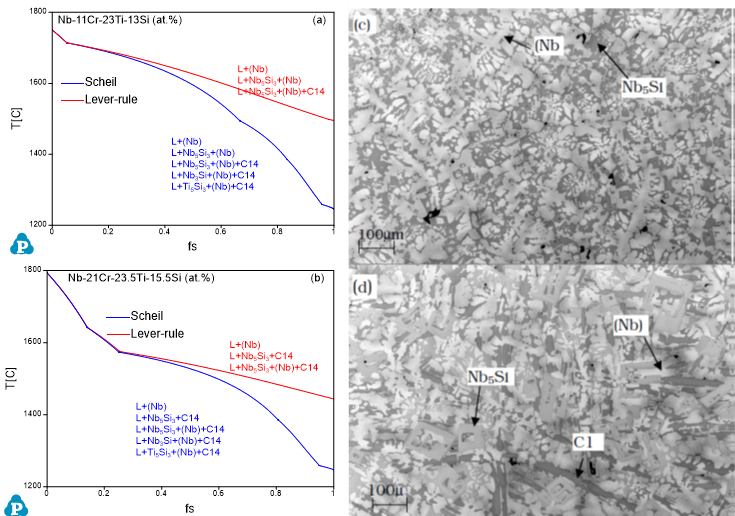
Figure 8: Calculated solidification paths with experimental observation (a) and (c) for alloy Nb-11Cr-23Ti-13Si; (b) and (d) for alloy Nb-21Cr-23.5Ti-15.5Si
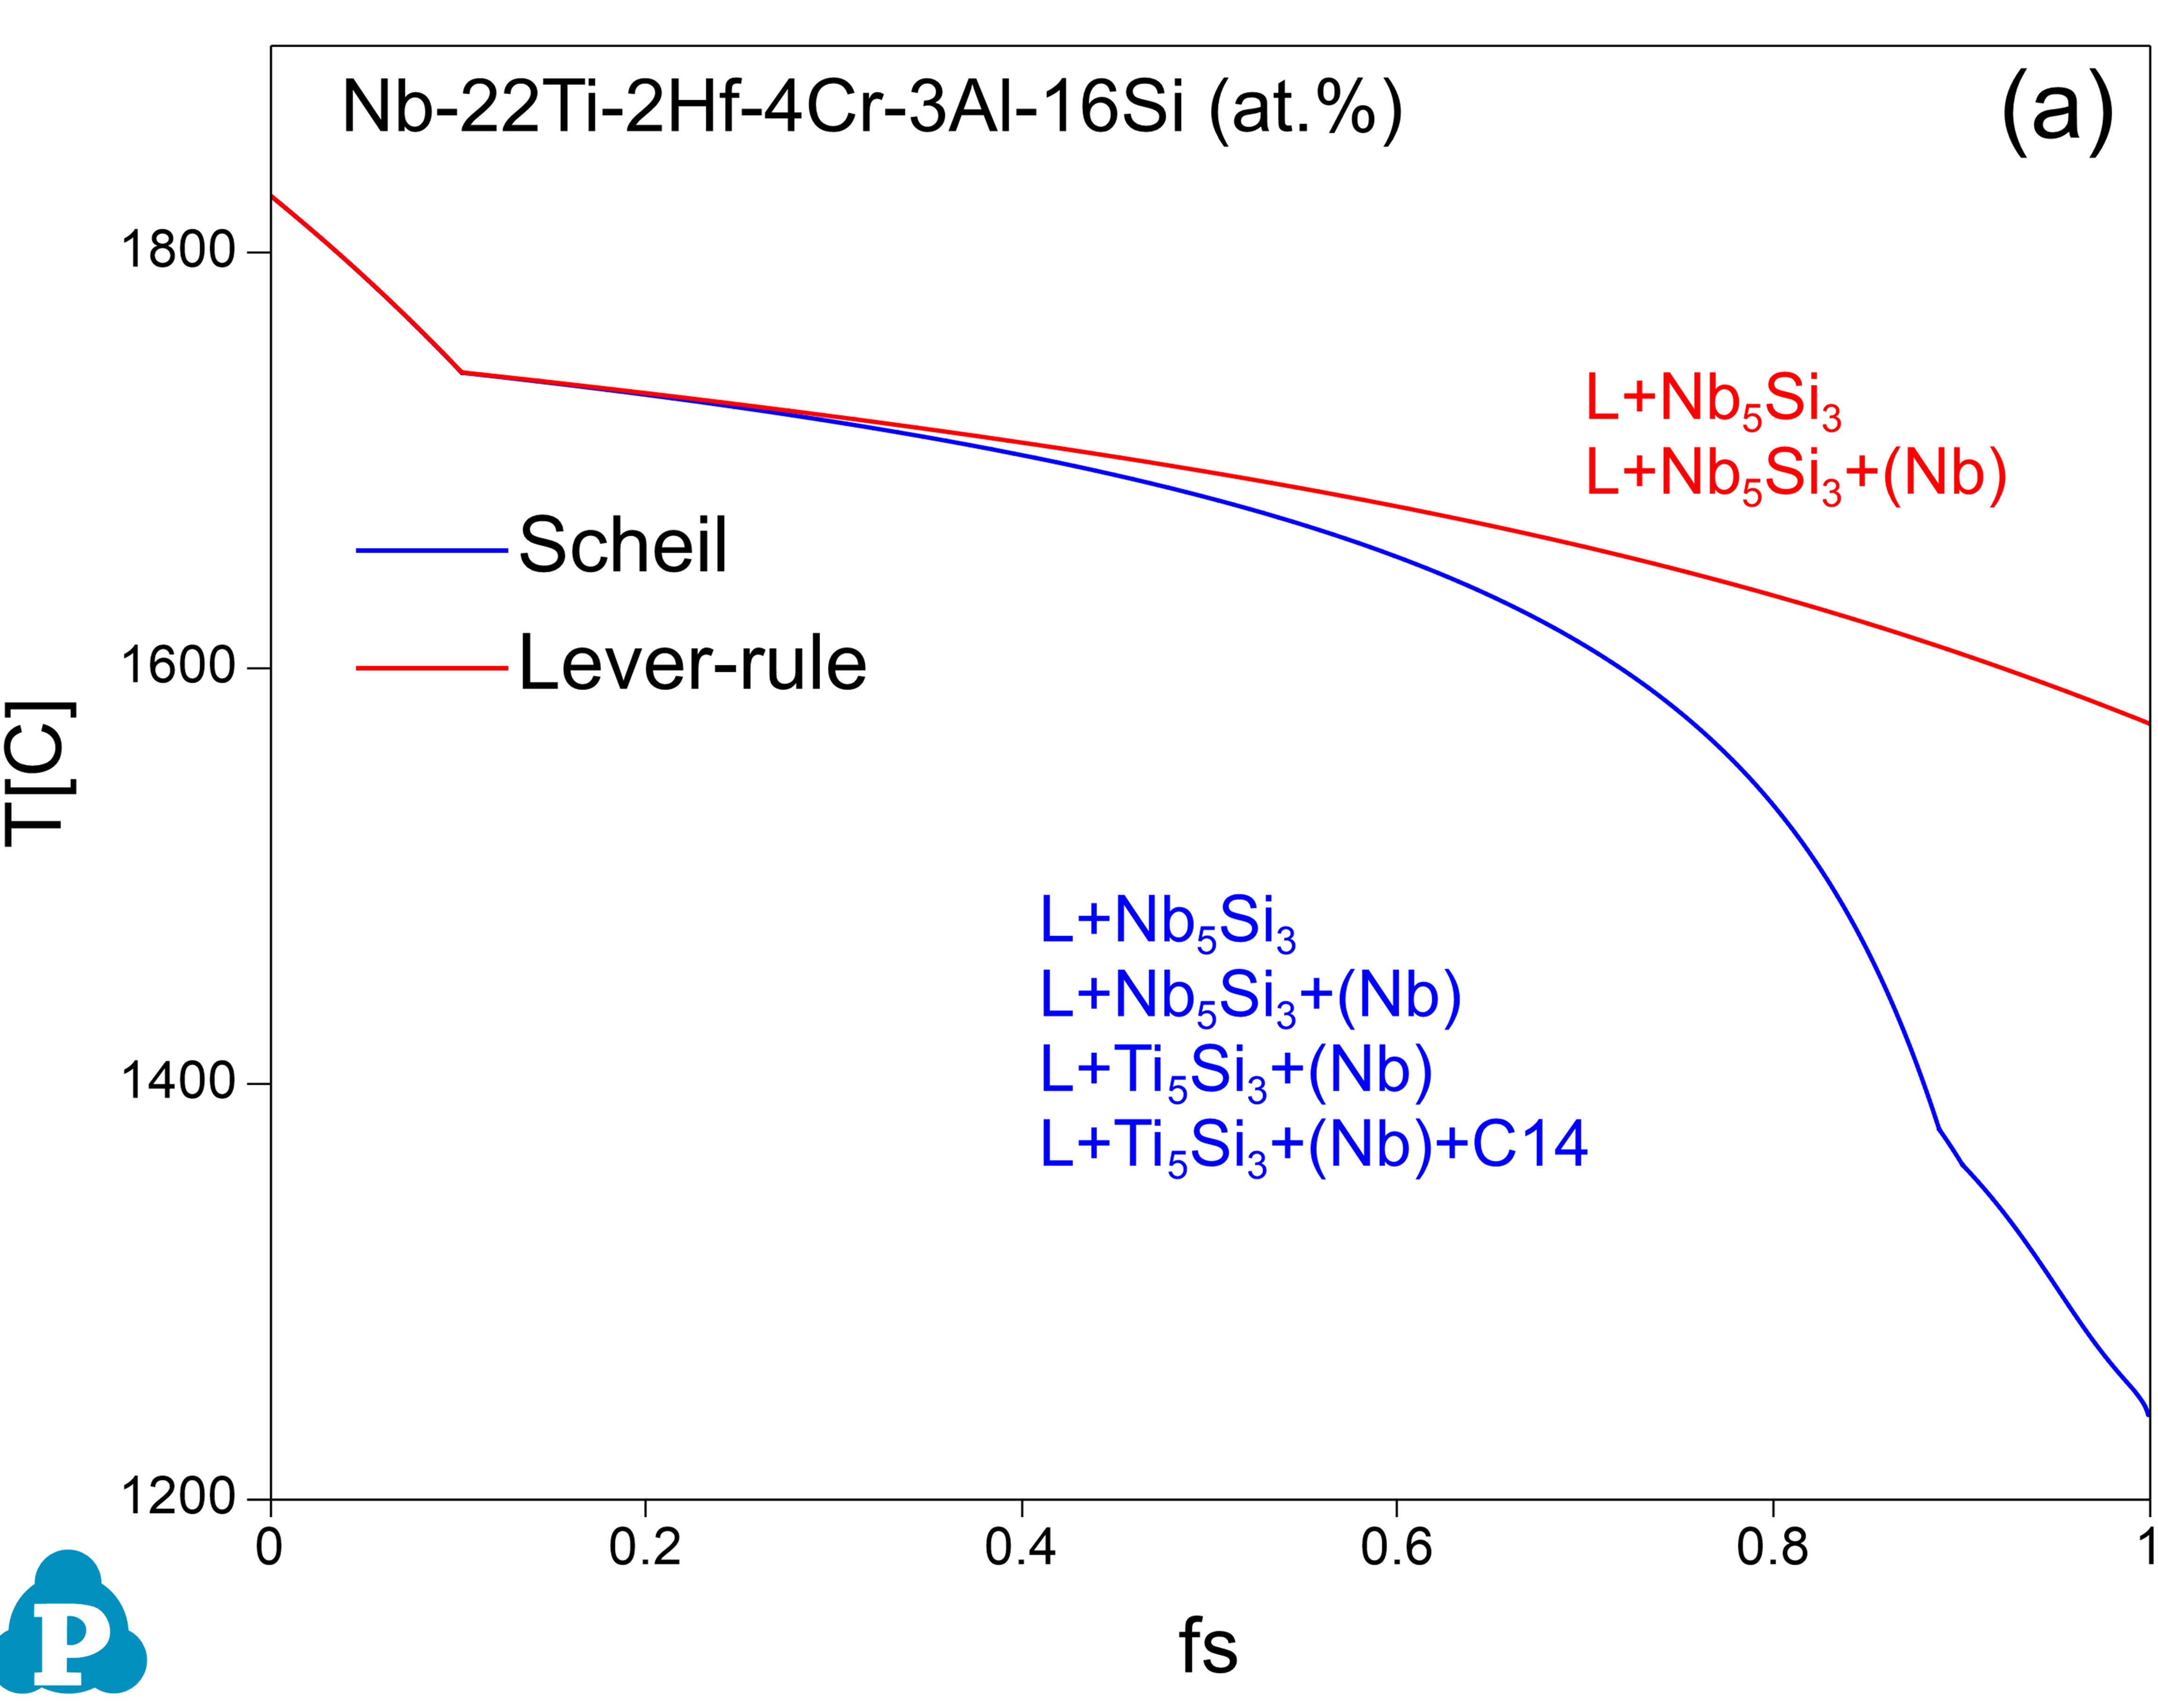
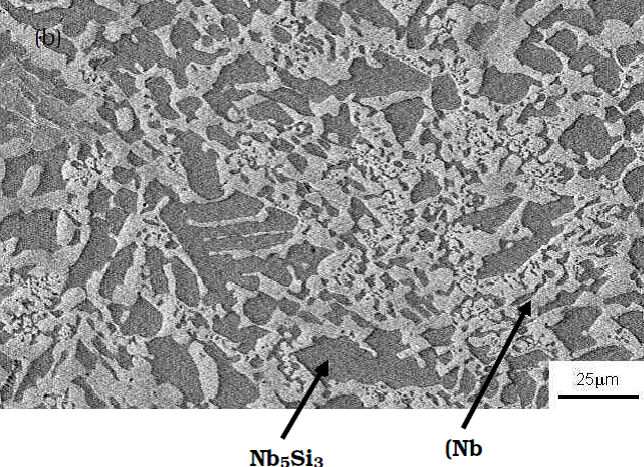
Figure 9: Calculated solidification path for alloys Nb-22Ti-2Hf-4Cr-3Al-16Si with experimental observation
[1997Bew] B. P. Bewlay, M. R. Jackson, H. A. Lipsitt, Journal of Phase Equilibria, 18(3)(1997): 264-278.
[1998Bew] B. P.Bewlay, M. R. Jackson, R. R. Bishop, Journal of Phase Equilibria, 19(6) (1998): 577-586.
[1999Bew] B.P. Bewlay, R.R. Bishop, M.R.Jackson, Zeitschrift fuer Metallkunde, 90(6) (1999): 413-422.
[2003Yan] Y. Yang,Y. A. Chang, J.-C. Zhao, B.P. Bewlay, Intermetallics: 11(5) (2003): 407-415.
[2007Bew] B. Bewlay, P.; Y. Yang, R. L. Casey, M. R. Jackson, Y. A. Chang, Materials Research Society Symposium Proceedings, 980 (2007): 333-338.
[2009Bew] B.P. Bewlay, Y. Yang, R. L. Caesy, M.R. Jackson Y. A. Chang, Intermetallics, 17(3) (2009): 120-127.